Population Changes Overview
This website examines the historical impacts of various ecological factors on White-tailed Deer and American Shad populations over the past 500 years in North America. The evidence reveals dramatic population fluctuations shaped primarily by human activities, habitat changes, and predator-prey relationships.
Key Findings
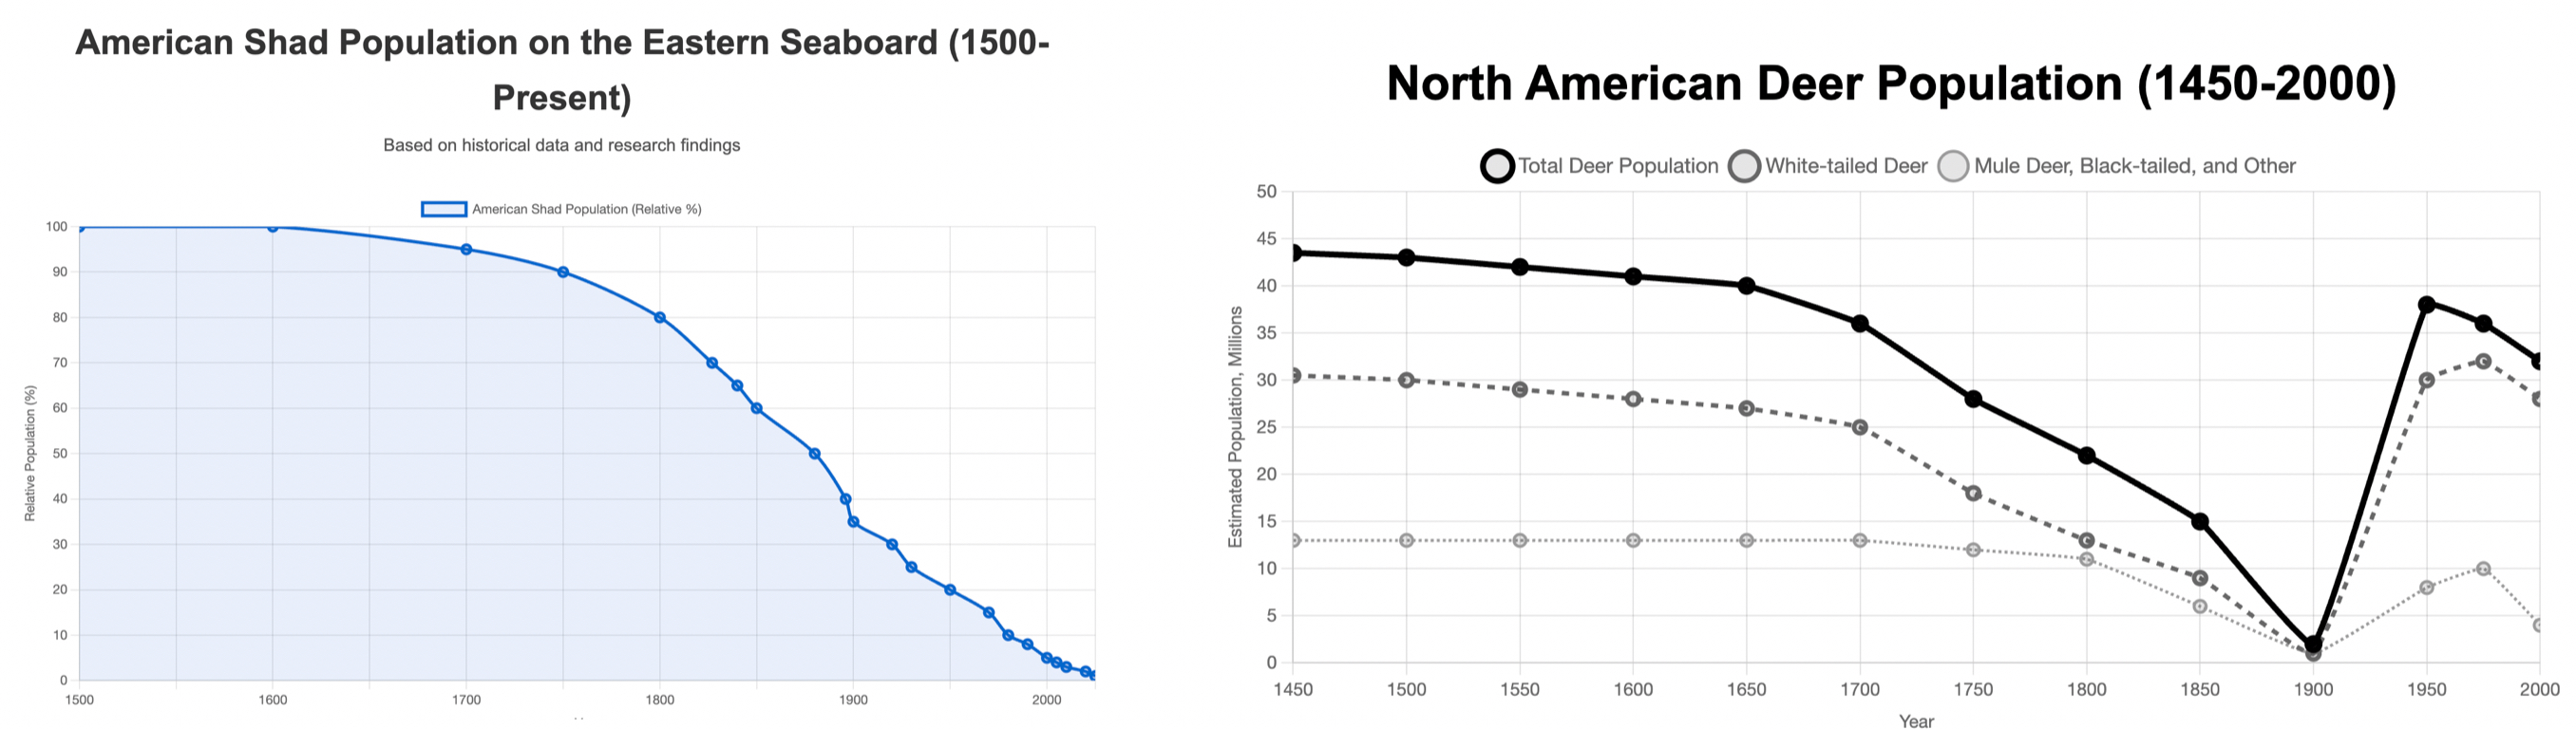
- White-tailed Deer: Population crashed from an estimated 24-33 million pre-European contact to fewer than 300,000 by 1900, then rebounded to over 30 million today.
- American Shad: Historic runs of millions declined by over 90% along the Atlantic coast, with some river populations completely extirpated.
- Human Impact: Both species experienced their most dramatic population changes due to human activities (hunting, habitat modification, dam construction).
- Climate Factors: Both species show sensitivity to temperature changes, with evidence suggesting ongoing climate change will create new challenges.
White-tailed Deer Population Impacts
Human Impacts
Human activities have caused the most dramatic changes in deer populations over the past 500 years.
- Pre-European contact: Estimated 24-33 million deer in North America
- By 1900: Population crashed to fewer than 300,000 deer due to unregulated hunting and habitat loss
- 2000s: Rebounded to 30+ million following conservation efforts, predator elimination, and suburban habitat creation
Sources: McCabe & McCabe (1984) - Of Slings and Arrows: An Historical Retrospection. In: White-tailed Deer: Ecology and Management; Halls (1984) - White-tailed Deer: Ecology and Management.
Predators (Gray Wolves)
Wolf predation historically regulated deer populations but their near-elimination allowed for dramatic deer increases.
- Pre-1800s: Wolves kept deer densities at 2-4 deer/km² in many regions
- By 1960s: Gray wolves eliminated from 95% of their range in lower 48 states
- Modern impacts: In areas with wolves (e.g., northern Minnesota), deer densities remain 30-40% lower than similar habitats without wolves
Sources: Ripple & Beschta (2012) - Trophic cascades in Yellowstone: The first 15 years after wolf reintroduction; Nelson & Mech (2006) - A 3-decade dearth of deer in a wolf-dominated ecosystem.
Habitat Availability
Changing forest cover has dramatically influenced deer abundance.
- 1600s: Approximately 46% forest cover in what would become the United States
- Early 1900s: Forest cover reduced to ~30% due to logging and agriculture
- 1970s-present: Abandoned farmland and forest regrowth created ideal edge habitat, contributing to 40-100% increases in deer density in many eastern regions
Sources: Foster et al. (2002) - Wildlife dynamics in the changing New England landscape; Alverson et al. (1988) - Forests Too Deer: Edge Effects in Northern Wisconsin.
Disease (Chronic Wasting Disease)
CWD represents a growing threat to deer populations.
- First detected in captive deer in Colorado in 1967
- By 2023: Present in 31 states and growing
- Impact: Local population declines of 10-40% in heavily infected areas
- Wyoming study: 19% annual population decline in infected herds
Sources: Edmunds et al. (2016) - Chronic wasting disease drives population decline of white-tailed deer; DeVivo et al. (2017) - Endemic chronic wasting disease causes mule deer population decline in Wyoming.
Parasites (Ticks)
Tick populations and impacts have increased with climate change and higher deer densities.
- Heavy winter tick infestations can cause 30-40% mortality in deer fawns
- Modern deer herds support up to 400,000 ticks per square mile
- In areas with high tick prevalence, deer can experience 5-15% blood volume loss
Sources: Bergeron & Pekins (2014) - Evaluating the usefulness of winter tick indices for winter tick infestations on moose; Paddock & Yabsley (2007) - Ecological havoc, the rise of white-tailed deer, and the emergence of Amblyomma americanum-associated zoonoses in the United States.
Climate Change
Temperature and precipitation changes affect deer in multiple ways.
- Warmer winters: 10-30% higher winter survival rates in northern ranges
- Extended growing seasons: 2-4 week increase in forage availability across much of North America
- Drought impacts: Severe droughts can reduce fawn survival by 30-50% in arid regions
Sources: Dawe & Boutin (2016) - Climate change is the primary driver of white-tailed deer (Odocoileus virginianus) range expansion at the northern extent of its range; Lashley & Harper (2012) - The effects of extreme drought on native forage nutritional quality and white-tailed deer diet selection.
American Shad Population Impacts
River Dams and Barriers
Dam construction has been the single most destructive factor for American shad populations.
- Pre-dam era: Shad migrations extended up to 500+ miles inland in major river systems
- By 1950: More than 1,100 dams blocked shad migration on Atlantic coast rivers
- Impact: 95-100% of upstream habitats blocked in many river systems
- Connecticut River example: Population declined from millions to fewer than 10,000 after dam construction
Sources: Limburg & Waldman (2009) - Dramatic declines in North Atlantic diadromous fishes; ASMFC (2020) - American Shad Stock Assessment.
Human Fishing Pressure
Commercial fishing dramatically reduced shad populations from colonial times through the 20th century.
- Colonial era: Shad harvests recorded at millions of pounds annually
- Peak commercial harvest (1896): 50 million pounds of American shad
- 2000s: Commercial harvest declined to less than 1 million pounds annually
- Overall decline: >98% reduction from historic harvest levels
Sources: ASMFC (2020) - American Shad Stock Assessment; Bilkovic et al. (2002) - The relationship between spawning habitat and stock decline in American shad.
Water Quality (Pollution)
Industrial pollution severely impacted shad populations in many river systems.
- 1800s-1970s: Severe industrial pollution in many rivers created oxygen-depleted "dead zones"
- Delaware River: Dissolved oxygen levels dropped to less than 1 mg/L (lethal to shad) in the 1940s-60s
- Post-Clean Water Act (1972): Delaware River shad runs increased from ~10,000 to >100,000 fish annually as water quality improved
Sources: Waldman (2013) - Running Silver: Restoring Atlantic Rivers and Their Great Fish Migrations; Limburg et al. (2003) - The good, the bad, and the algae: Perceiving ecosystem services and disservices generated by zebra mussels.
Climate Change (Ocean and River Temperatures)
Changing temperatures affect migration timing, spawning success, and survival rates.
- Migration timing: Shad river entry has shifted 2-3 weeks earlier in some systems due to warming temperatures
- Egg development: Temperatures above 27°C (80.6°F) cause significant egg mortality
- Juvenile survival: 20-40% lower juvenile survival in years with temperatures exceeding optimal ranges
Sources: Staudinger et al. (2019) - It's about time: A synthesis of changing phenology in the Gulf of Maine ecosystem; Leach & Houde (1999) - Effects of environmental factors on survival, growth, and production of American shad larvae.
Predators (Striped Bass)
Striped bass predation impacts shad populations, particularly in systems with altered habitat.
- Dam impacts: Shad concentrate below dams, resulting in 30-45% predation rates by striped bass in some systems
- Striped bass recovery: Striped bass populations increased 400% since the 1980s following conservation measures
- Connecticut River study: Showed striped bass consumed up to 90% of shad attempting to pass fish ladders
Sources: Tuomikoski et al. (2008) - Effects of sea-run striped bass predation on spawning migration of American shad; Walter et al. (2003) - Atlantic coast feeding habits of striped bass: a synthesis supporting a coast-wide understanding of trophic biology.
River Flow Variability (Flooding and Drought)
Altered flow regimes affect shad reproduction and juvenile survival.
- Optimal flow: Shad egg survival is 40-60% higher during moderate, stable flows
- High flows: Floods can reduce egg survival by up to 80%
- Low flows: Droughts and water withdrawals can reduce juvenile survival by 30-70%
Sources: Crecco & Savoy (1984) - Effects of fluctuations in hydrographic conditions on year-class strength of American shad; Weaver et al. (2018) - River flow and temperature dynamics affect American shad reproduction.